
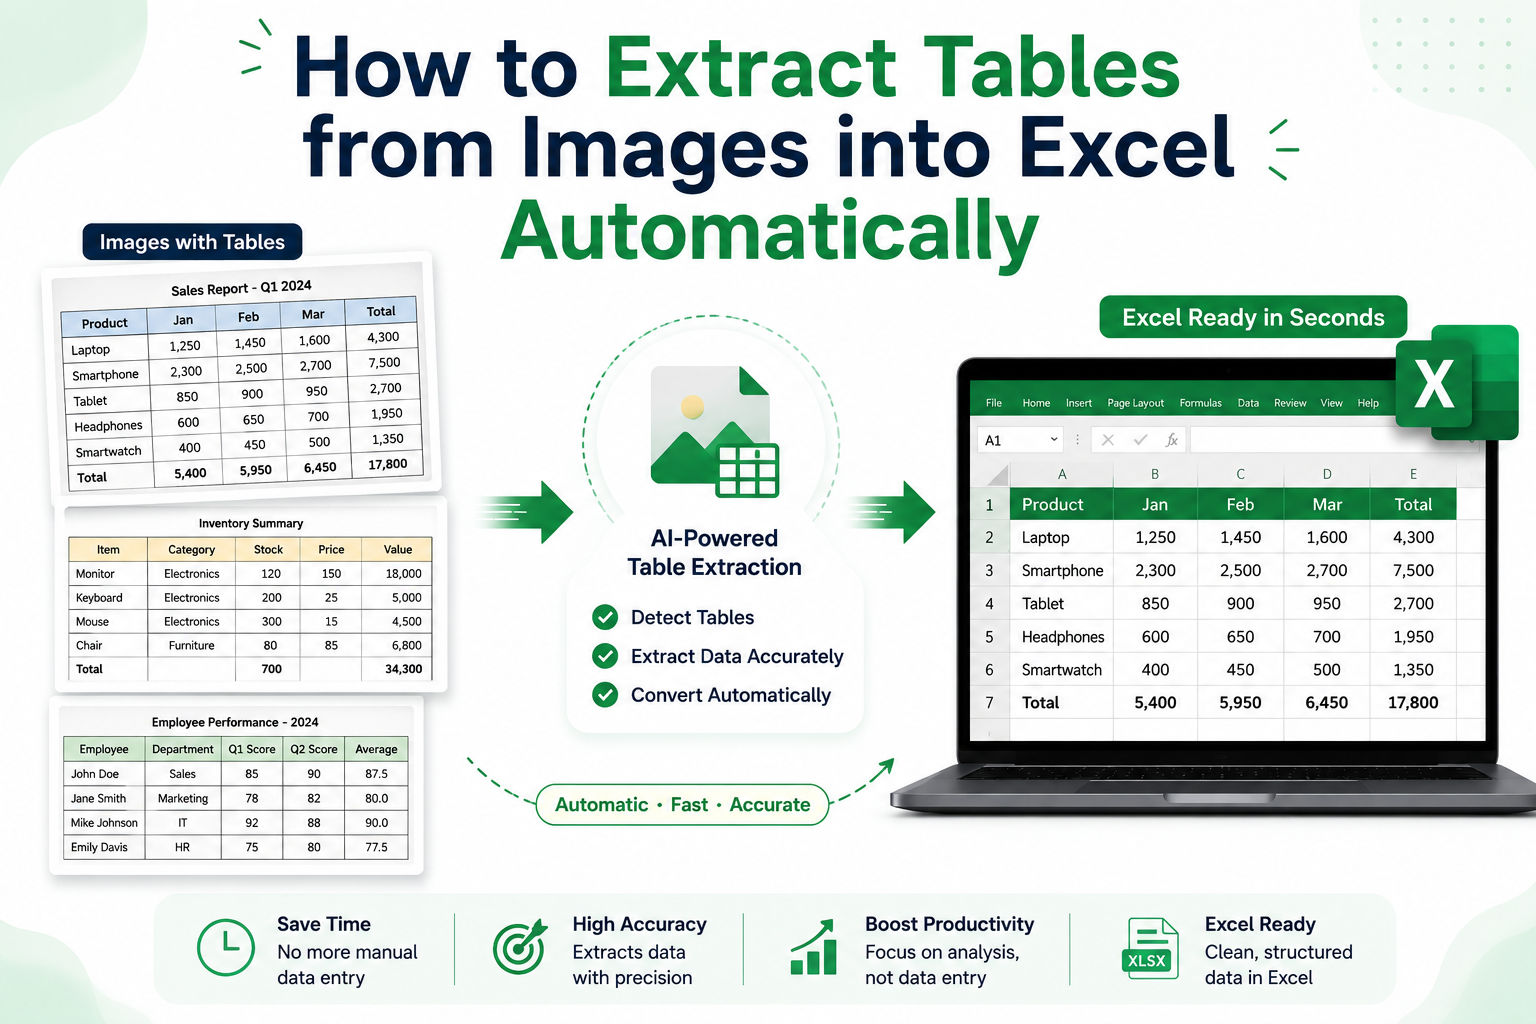
You’ve got a table inside an image. Could be a scanned invoice, a photo of a printed report, a screenshot from a website that won’t let you copy anything. The data is right there in front of you but it might as well be locked behind glass.
Manually typing it into Excel is an option. A slow, frustrating, error-prone option.
The better option is to let a free tool do it in under a minute. This guide walks you through exactly how to extract tables from images into Excel automatically, what the process looks like, which free tools work reliably, and how to get clean output without spending an hour on cleanup afterward.
Why You Can’t Just Copy a Table from an Image
Before getting into the tools, it helps to understand why this problem exists in the first place.
When a table is saved inside an image as a JPG, PNG, BMP, or embedded in a scanned PDF, your computer has no idea it contains rows, columns, or numbers. It sees pixels. A flat grid of color values. There’s no cell structure, no data layer, nothing to select or copy.
To get that table into Excel, something needs to:
- Read the text and numbers inside the image (OCR – Optical Character Recognition)
- Figure out where the rows and columns are (table structure detection)
- Place each value into the correct cell in a spreadsheet
That’s the process. The difference between tools that work and tools that disappoint is almost entirely in step two. Anyone can extract raw text from an image. Reconstructing the actual table structure with the right values in the right cells, is harder, and it’s where most free tools either succeed or fall apart.
Method 1: Use a Dedicated Image to Excel Converter (Fastest and Most Accurate)
The most reliable way to convert images to Excel is a tool built specifically for tables not a general OCR scanner, but something trained to detect and preserve tabular structure.
JPG-to-Excel.net
JPG-to-Excel.net is one of the cleanest free options available. It’s built purely for this use case: upload an image, get back a structured .xlsx file.
What makes it work well as a JPG to Excel converter is the table detection layer. It doesn’t just dump extracted text into a single column, it identifies column boundaries, recognizes row separators, maps header relationships, and places each value into the correct cell position. The output opens directly in Microsoft Excel or Google Sheets with no reformatting needed.
How to use it:
- Go to JPG-to-Excel.net
- Drag and drop your image (JPG, PNG, WEBP, and other formats supported)
- The AI-powered OCR processes the image and detects the table structure
- Preview the result before downloading
- Download your .xlsx file
No account required. Files are deleted after conversion. Works on mobile and desktop.
Best for: Invoices, price lists, financial tables, scanned reports, any document where table structure needs to be preserved accurately.
OCR.ac Image to Excel Tool
OCR.ac takes the same approach with a few features that make it especially useful for volume work and international documents.
The OCR engine handles multiple languages, so if you’re working with vendor documents in another language or international business reports, it processes these without any manual language switching. It also supports batch conversion, meaning you can upload multiple images at once and get them all processed in parallel rather than waiting for each one individually.
How to use it:
- Visit OCR.ac
- Upload your image or drag and drop the file
- The OCR engine scans, detects the table layout, and extracts the data
- Review the real-time preview of your converted spreadsheet
- Download the .xlsx file, your data is then permanently deleted from their servers
Best for: Batch processing multiple documents, multilingual files, scanned attendance sheets, bank statements, catalog pages.
Method 2: Microsoft Excel’s Built-In “Data from Picture” Feature
If you’re already working inside Microsoft 365 (Excel on Windows or Mac), there’s a built-in option worth knowing about.
Go to Insert → Data → Data from Picture in Excel, and you can upload an image directly. Excel’s OCR engine will attempt to extract the table and place it into your sheet.
When it works well: Clean, high-resolution screenshots or scans with simple table structures, clear grid lines, and printed text.
Where it struggles:
- Tables without visible borders (whitespace-aligned columns)
- Merged or multi-level headers
- Phone photos taken at even a slight angle
- Images with content outside the table area
- Complex table layouts with irregular spacing
The output often lands everything in a single column and requires significant manual correction for anything beyond a basic two or three-column table. It’s a useful fallback when you’re already inside Excel and the table is simple, but it’s not the first tool to reach for.
How to use it:
- Open Excel (Microsoft 365)
- Click Insert → Data → Data from Picture
- Upload your image
- Review the suggested data in the side panel
- Click Insert Data to place it into your sheet
No additional software needed but you do need a Microsoft 365 subscription.
Method 3: Google Docs OCR (Completely Free, No Account Limitations)
Google Docs has a lesser-known OCR feature that can extract text from images. It’s not designed specifically for tables, but it works for simple structures and costs nothing.
How to use it:
- Go to Google Drive and upload your image file
- Right-click the image and select Open with → Google Docs
- Google Docs opens a new document with the extracted text below the image
- Copy the extracted content and paste it into Google Sheets
- Use Data → Split text to columns to attempt column separation
The limitation here is significant: Google Docs OCR reads left-to-right, top-to-bottom without understanding column structure. For a simple two-column list it works reasonably. For a table with five or more columns, complex headers, or merged cells, the output is usually a pile of values that needs manual restructuring.
Best for: Very simple tables, occasional one-off conversions, situations where you have no other tools available.
Step-by-Step: How to Convert Image to Excel Using a Free Tool
Here’s the complete workflow using JPG-to-Excel.net or OCR.ac both follow the same basic pattern:
Step 1 – Prepare Your Image
Spend 60 seconds on input quality. It makes a real difference in output accuracy.
- If photographing a physical document: Hold your phone or camera directly above the document, parallel to the surface. Avoid shooting at an angl, even 10–15 degrees of tilt can cause column misalignment in the output.
- If using a scanner: Set resolution to at least 300 DPI. Higher is better for small text.
- Crop before uploading: Remove any content outside the table, logos, headers, footnotes, page numbers. The cleaner the input, the more accurately the engine detects the table boundaries.
- For screenshots: Save as PNG rather than JPG. PNG is lossless and preserves sharp text edges that JPG compression can blur.
Step 2 – Upload the Image
Drag and drop your file onto the upload area, or click to browse. Both tools accept JPG, PNG, WEBP, BMP, and other common formats. File size limits are generous enough for any normal document image.
If you have multiple images, multiple invoice pages, multiple catalog sections OCR.ac’s batch upload processes them all simultaneously.
Step 3 – Let the Tool Extract the Table
The OCR engine runs automatically. You don’t need to define columns, draw selection boxes, or configure any settings. The AI handles:
- Image pre-processing (contrast, skew correction, noise reduction)
- Table boundary detection
- Column and row structure mapping
- Character recognition cell by cell
- Output formatting as .xlsx
For most images this takes 15–30 seconds. Complex multi-column documents or large tables may take slightly longer.
Step 4 – Review the Preview
Before downloading, check the extracted output against your original image. Look at:
- Column count – Does the number of columns match the original?
- Header row – Are the column headers captured correctly?
- Numeric values – Spot-check 5–10 numbers against the original image
- Row count – Does the total row count match?
This review takes 2–3 minutes and catches any edge cases before the file goes into your actual workflow.
Step 5 – Download and Use
Download the .xlsx file and open it in Excel or Google Sheets. Your table is now fully editable, sort columns, apply formulas, filter rows, create charts, paste into other systems. Whatever you need to do with the data, it’s now possible.
Real Examples: When This Matters
The procurement coordinator with 40 supplier price lists
Every quarter, suppliers send updated pricing catalogs as image files. Each catalog has 60–100 line items across columns for product code, description, unit, price, and minimum order. Processing these manually used to take 3–4 hours per catalog.
Using a dedicated image to Excel converter, each catalog now takes under 5 minutes, upload, review, download. The structured output pastes directly into the internal pricing tracker. The error rate dropped because human transcription is no longer part of the chain.
The student extracting data from textbook tables
Academic papers and textbooks contain data tables that can’t be copied as text, they’re embedded as images in scanned PDFs. Photographing the table with a phone and uploading it to a photo to Excel tool produces a usable spreadsheet in under a minute. A 20-row data table that used to take 20 minutes to type now takes less than 60 seconds.
The HR team digitizing old attendance registers
Physical attendance registers from several years back needed to be digitized for compliance reporting. Each page had 30 rows and 15 columns of employee names, dates, and attendance codes. Batch converting the scanned pages through OCR.ac processed multiple pages at once, what management estimated as two weeks of manual entry was completed in three days.
What Makes a Picture to Excel Conversion Actually Work
Not every image converts cleanly. Here’s an honest breakdown of what affects output quality:
High accuracy – what works well:
- Printed text in standard fonts (Arial, Times, Calibri, etc.)
- Tables with visible grid lines or clear cell borders
- High-resolution scans (300 DPI or above)
- Screenshots from screens (sharp text, no camera distortion)
- Good lighting with even illumination across the whole document
Lower accuracy – what needs extra care:
- Phone photos taken at an angle
- Low-resolution or heavily compressed JPG files
- Tables with no borders (whitespace alignment only)
- Colored or patterned backgrounds behind table content
- Decorative or script fonts
- Dense handwriting (block handwriting is manageable; cursive is harder)
For most standard business documents, invoices, statements, price lists, reports a good picture to Excel converter delivers output that requires zero or minimal cleanup. The exceptions above are edge cases, not the norm.
Choosing the Right Free Tool for Your Situation
| Situation | Best Tool |
| Single invoice or price list, quick conversion | JPG-to-Excel.net |
| Multiple images to process at once | OCR.ac (batch upload) |
| Multilingual documents | OCR.ac (multi-language OCR) |
| Already inside Microsoft 365 | Excel’s “Data from Picture” |
| Occasional simple table, no other tools | Google Docs OCR |
For most use cases, especially anything involving table structure that needs to stay intact a dedicated image to Excel converter like JPG-to-Excel.net or OCR.ac produces significantly cleaner output than generic alternatives. The reason is simple: they’re built for this specific problem, not adapted from a general-purpose OCR engine.
Tips for Getting the Best Output Every Time
These habits make a consistent difference:
Shoot from directly above. When photographing physical documents, the camera should be parallel to the paper surface, not tilted. Skew is the most common cause of column misalignment in extracted tables.
Crop to the table. Remove everything outside the table area before uploading. Headers, footers, logos, and surrounding text create noise that can confuse structure detection.
Use PNG for screenshots. PNG preserves the sharp edges of text characters that JPG compression softens. When capturing tables from screens, PNG gives cleaner OCR input.
Good lighting matters more than you think. Shadows across a table, even light ones from overhead lighting at an angle, can obscure individual characters and cause misreads. Diffuse, even lighting produces the best results.
For large tables, consider splitting. If you have a very wide table (10+ columns) or a very tall one (200+ rows), splitting it into two or three crops sometimes produces cleaner output than processing the full image at once.
Always spot-check before using the data. A 3-minute review of your downloaded file, checking column structure and a sample of numeric values, takes almost no time and catches any issues before they reach your actual spreadsheet or system.
The Bottom Line
Extracting tables from images used to mean manual retyping of slow, error-prone work that produced no value beyond moving data from one format to another.
Free tools like JPG-to-Excel.net and OCR.ac have made this a solved problem for most standard documents. Upload your image, get your spreadsheet, move on to the work that actually requires your attention.
The process takes under a minute. The tools are free. There’s no good reason to still be doing this by hand.
